
Actionable insights based on student learning data
Data is arguably the world’s most valuable commodity. However, the challenge with data is that there’s tons of it, and raw, unorganized data is difficult to analyze.
Previous research has shown that visualizations are a powerful tool in conveying the story behind the data. Visualizations help most people to identify patterns, gather insights, and maximize value from any given subset of information.

Analyze and better understand student performance with data visualizations
Using student performance data from Codio’s browser-based IDE and auto-graded assessments, we identified a few pain points that most CS educators faced:
- Can we generate interesting metrics to gauge class performance beyond mean, median, and standard deviation?
- Is there a way to take all this data to generate significant student learning insights?
- Is there a way to estimate student cognitive load?
Codio launches Learning Insights
To address these pain points and aid instructors to better understand class performance and assessment effectiveness, Codio launches Learning Insights powered by Looker.
Looker is a business intelligence and big data analytics platform that enables users to easily explore, analyze, and see real-time analytics. Looker creates visualizations from data directly from the source and provides real-time updates. When necessary, users can drill deep into row-level detail from the visualization.
Using Looker’s powerful visualization tools, Codio now provides student level, unit level, module level, and class level dashboards that give instructors actionable insights across all areas of student learning.

From overall class performance to individual student cognitive load estimates, Codio’s Learning Insights brings all the relevant pieces of information together on one screen—accessible with the press of a button.
Let’s take a look at the valuable and actionable learning insights within each insights dashboard:
Class Insights Dashboard
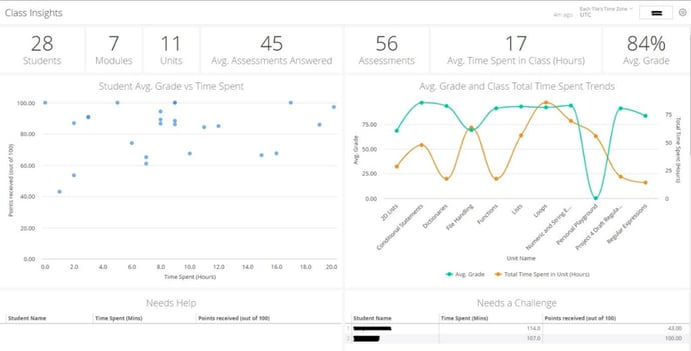
Key Features:
- The number of students, modules, units, and assessments, all in one place.
- The average number of assessments answered, average total time spent by students in a class and the average class grade.
- A scatter plot visualization of the average student grade vs. time spent in class to identify students that need help, need more of a challenge or are within the zone of proximal development (ZPD)—an estimate of student cognitive load.
- A trend Line chart of the average class grade with the total time spent by a class per unit to highlight the units which demanded more of a cumulative effort by the class.
- A sortable “table of everything” with all relevant student data.
Module Insights Dashboard
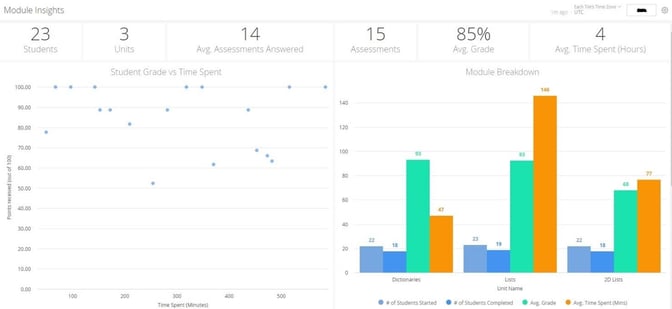
Key Features:
- All relevant and basic class-level Insights drilled down to the module level.
- A scatter plot visualization of the average student grade vs time spent in class to classify students needing help, need to be challenged or are in the zone of proximal development (ZPD).
- A grouped bar chart visualization to compare the number of students that started a given unit, the number of students that completed that unit, the average student grade in the unit, and the average time spent by students on it.
- A sortable “table of everything” with all relevant student data.
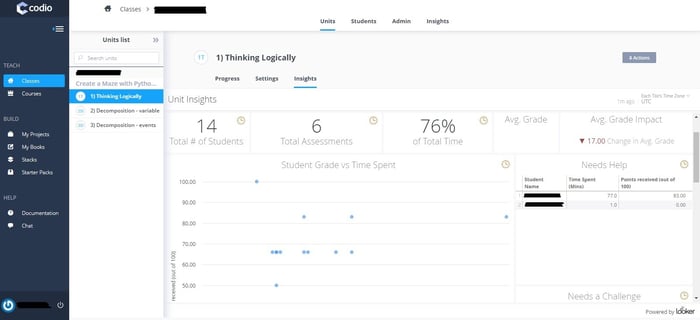
Assignment Insights Dashboard
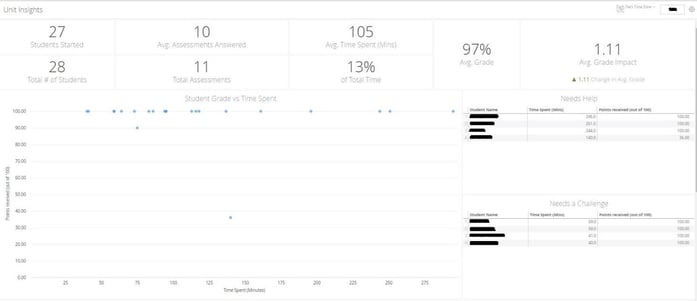
Key Features:
- All relevant and basic class-level insights, down to the unit level.
- The average percentage of time spent on the unit by the class.
- The average grade impact of the unit on class average grade (i.e. the number points the average grade of the class increased or decreased due to class performance in the unit).
- A scatter plot visualization of the average student grade vs time spent in class to identify students that need help, need to be challenged or are in the zone of proximal development (ZPD).
- A sortable table of everything with all relevant student data.
Student Insights Dashboard
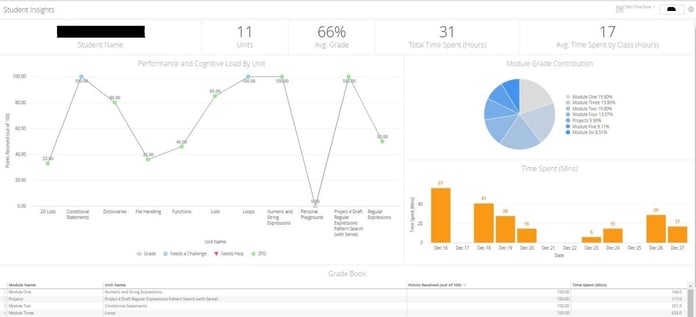
Key Features:
- Student’s name, number of units started by the student, and average grade across all units.
- A comparison between the total time spent in class by the student and the overall class average.
- A trend line chart to map student performance across all units along with the cognitive load estimate cross-referenced by class performance for the respective unit.
- A pie chart that shows the contribution of each module to the average student grade, which can be drilled into to see the unit level grade contribution for the respective modules.
- A bar chart to see the distribution of time spent in class by the student over the previous two week period.
- A sortable grade book with all relevant information about the student.
We’ll be including even more in-depth and innovative learning insights in future iterations of these dashboards, enabling you to make use of your students’ performance data in exciting new ways!
Do you have questions or want to learn more about learning insights? Speak with a team member or request a demo today!